About the Data
Detailed analysis including references, class breaks, caveats, and supporting information.This page provides detailed information for analyses performed to create the InSite by NatureServe report, including references, details on class breaks, caveats, and any other supporting information.
The InSite by NatureServe report is based on national data, including spatial models, and is intended to provide an overview summary of biodiversity assets and the estimated relative biodiversity value across a site. It is not intended to replace on-site inventory and monitoring or state environmental review processes, though it does provide information to (1) support planning for the former and (2) connect users to local data and environmental review tools available through NatureServe’s state member programs for the latter.
The following About the Data page is ordered the same as the sections of the InSite by NatureServe report.
Executive Summary
This section of the report summarizes relative biodiversity scores across various measures of biodiversity value. More information about each biodiversity metric is detailed below.
NatureServe InSite Score
The dial shown represents the NatureServe InSite Score for the area of interest. This is an integrated biodiversity value score for the site based on the sub-metrics described below. The dial displays the InSite score for the site as well as nested dials showing the average InSite score for the nation (conterminous United States) and the average for states that overlap with the site, allowing users to understand the biodiversity value their area of interest holds within national and regional contexts.
Scores can range from 0-100. The assigned sticker below the dial is based on a comparison of the site average to the national average and can have the following values:
- Far Above Average – more than 30% above the national average
- Above Average – more than 10-30% above the national average
- Average – within 10% of the national average
- Below Average – less than 10-30% below the national average
- Far Below Average – less than more than 30% below the national average
Scores by Sub-Metric
Species Extinction Risk
The species extinction risk dataset identifies areas where species at risk of extinction are likely to occur. This measure is derived from predicted and documented species distributions developed by NatureServe for those species that are at-risk of extinction. This includes species habitat models described in Hamilton et al. (2022), newer additions to this database of models, and documented occurrence locations for species without habitat models. More information on documented and predicted species distributions can be found in Section 3: Species & Habitat Field Report in this About the Data documentation.
Species at risk of extinction are defined as those with a global conservation status (NatureServe Global Conservation Status rank) of Globally Critically Imperiled (G1), Globally Imperiled (G2), or Globally Vulnerable (G3) or that are partially or fully listed as threatened, endangered, or candidate species under the U.S. Endangered Species Act. More information about NatureServe’s conservation status ranking methodology is available here.
The input species distribution data were weighted based on range-size rarity (RSR) for predictive Species Habitat Models (SHMs) or proxy range-size rarity scores for documented occurrences. For species with an SHM, the inverse of the model’s distribution area was used to calculate range-size rarity, giving greater weight to species with small distributions. For species represented by documented occurrences, a proxy RSR score was assigned based on the species’ g-rank:
- Globally Critically Imperiled (G1) = 0.01
- Globally Imperiled (G2) = 0.001
- Globally Vulnerable (G3) = 0.0001
- Globally Apparently Secure (G4) = 0.00001
- Globally Secure (G5) = 0.00001
These proxy scores were chosen based on the modal distribution size ranges for species with habitat models to align proxy RSR scores with RSR values for modeled species with the same g-rank. After applying the RSR or proxy RSR score to each species all distributions were then spatially summed to generate an initial output ranging from 0 to 9.35.
To more easily interpret the distribution of values, this output was rescaled to 0-100. We assigned a score of 100 to values in the 99th percentile, 99 to those in the 98th percentile, 98 to those in the 97th percentile, and so on.
The normalized extinction risk raster was then used to calculate the average extinction risk score across three geographic areas: the site of interest, the overlapping states, and the nation. These averages are visualized in the accompanying dial. The label (or “sticker”) displayed below the dial reflects how the site’s average extinction risk score compares to the national average. The possible categories are:
- Far Above Average – more than 30% above the national average
- Above Average – more than 10-30% above the national average
- Average – within 10% of the national average
- Below Average – less than 10-30% below the national average
- Far Below Average – less than more than 30% below the national average
To see a list of species documented or predicted to occur within or adjacent to the site look at Section 3 of the report Species & Habitat Field Report. Note that at present, Arizona and Wyoming are not contributing documented occurrence data to InSite reports.
Priority Ecosystem Extent
The Ecosystem Extent metric is a measure of how much of the site is covered by globally imperiled vegetation ecosystem types, scaled by the level of risk for included ecosystems. Ecosystem Risk is summarized from the global conservation statuses of ecosystems within the site. Ecosystems are defined from the U.S. National Vegetation Classification (NVC) at the “group” level (Franklin et al. 2012). Groups are a mid-level ecosystem classification unit that reflect distinctive combinations of dominant and co-dominant species in the context of regional-to-continental scale climate, geology, and water cycles, and disturbance patterns of fire, wind, and flood. At-risk groups are defined as those with a provisional global conservation status of Imperiled (G1 and/or G2) or Vulnerable (G3), which indicates that the type is at risk of collapse across its full distribution.
The analysis includes NVC groups that have been mapped as of May 2025 (v1.0). The source map used in this analysis is the LANDFIRE Remap 2022 Existing Vegetation layer for the contiguous United States. The LANDFIRE ecological systems were cross walked to the NVC 3.0 classification at the group level and subsequently modified where LANDFIRE classes had to be split to reflect expert knowledge of NVC group distributions. To identify at-risk ecosystems, each group is assigned a global conservation status using NatureServe’s conservation status ranking methodology which considers rarity, threats, and trends across the full distribution of the group.
The site boundary was intersected with the NVC group (30m-pixel resolution) map to calculate the proportion of mapped areas occupied by ecosystems with g-ranks of G1 (critically imperiled), G2 (imperiled), G3 (vulnerable), G4 (apparently secure), G5 (secure), GNR (not ranked groups), and GNA (non-natural types). Pixels in each ranking category were scored as follows and an average was taken across the whole site:
- G1 = 100
- G2 = 100
- G3 = 75
- G4 = 50
- G5/GNR = 50
- GNA = 0
The resulting Priority Ecosystem Risk scores range from 0-100, and were calculated across the site, the overlapping states, and the conterminous US and are visualized in the accompanying dial. The sticker displayed below the dial reflects how the site’s average Priority Ecosystem Risk compares to the national average. The possible categories are:
- Far Above Average – more than 30% above the national average
- Above Average – more than 10-30% above the national average
- Average – within 10% of the national average
- Below Average – less than 10-30% below the national average
- Far Below Average – less than more than 30% below the national average
Conservation status ranks are calculated for each NVC group globally, with no scaling to the condition within the site.
Note: the ecosystem map was originally developed for applications at scales >1:100,000 or for areas exceeding 100 km². Although it can be informative at finer scales, users should exercise caution when applying it to smaller areas. For further guidance or to share feedback, please reach out to NatureServe.
Ecosystem Condition
Ecosystem Condition was measured using NatureServe’s Landscape Condition Model (Hak and Comer 2017). This model is parameterized from the expected ecological effects that different anthropogenic land uses (e.g. roads, development, agriculture, mines) have on nearby areas and the rates at which these effects are expected to diminish with distance from the contributing land use. The model has been calibrated against field-based measurements of ecological condition. Pixel scores range from 0-100 with higher values representing areas that are in the best condition.
The Landscape Condition Model (30m-pixel resolution) was used to calculate the average Ecosystem Condition across four geographic areas: the site of interest, the overlapping states, the overlapping ecoregions, and the conterminous US. These averages are visualized in the accompanying dial. The sticker displayed below the dial reflects how the site’s average Ecosystem Condition score compares to the national average. The possible categories are:
- Far Above Average – more than 30% above the national average
- Above Average – more than 10-30% above the national average
- Average – within 10% of the national average
- Below Average – less than 10-30% below the national average
- Far Below Average – less than more than 30% below the national average
Site Details
This section of the report provides further details regarding the biodiversity value present within the site of interest.
Species Extinction Risk
Species Extinction Risk Overview
This subsection summarizes how the site’s Species Extinction Risk score compares to the national and state averages. It offers insight into the relative level of risk for biodiversity loss within the site.
Areas of High Extinction Risk
This map displays the distribution of Species Extinction Risk categories across the site of interest. A legend identifies the number of acres within each risk category. The risk categories are defined as follows:
- Very High: Extinction Risk values > 75
- High: Extinction Risk > 50 and < 75
- Medium: Extinction Risk > 25 and < 50
- Low: Extinction Risk = < 25
Note: Low Extinction Risk does not guarantee the absence of at-risk species, rather indicates a lack of documented or predicted habitat for the species included in the Extinction Risk map.
If the site overlaps with NatureServe’s map of Areas of Unprotected Biodiversity Importance (AUBI), a “CONSERVATION OPPORTUNITY: This site contains areas likely to support imperiled species that are not well protected in national parks or other conservation areas. These places are especially important for preventing extinctions.” message is shown. AUBI identifies areas across the contiguous U.S. that are likely to support habitat for species that are highly imperiled (G1, G2, or ESA listed threatened or endangered) AND that lack sufficient protection in the nationwide set of conservation areas based the Protected Areas Database for the United States (PAD-US v4.0, GAP 1 or 2 lands managed for biodiversity).
Recommended actions:
This section offers site-specific recommendations for land management and conservation practices to address and reduce Extinction Risk.
Species Extinction Risk for Key Taxonomic Groups
This subsection highlights four key taxonomic groups found in the Species Extinction Risk metric: Plants, Freshwater Invertebrates, Pollinators, and Vertebrates. Dials display extinction risk scores (ranging from 0–100) for each group. These scores may differ from the overall site score, sometimes significantly, because the overall map includes additional species not part of these groups (i.e. non-pollinating insects, other invertebrates, fungi).
Recommended actions:
This section provides suggestions on ways to initiate good land use practices and conservation planning for the taxonomic groups driving Species Extinction Risk across the site.
Imperiled Species On or Near the Site
This subsection summarizes information on species of conservation interest that have been documented in the vicinity of the site, based on the intersection of the site boundary with Element Occurrence (EO) data maintained by NatureServe Network programs. EOs represent documented (contrast with modeled habitat in Extinction Risk sections) locations occupied by individuals of a species at a specific point in time.
NatureServe Network programs track occurrences of species across their jurisdictions. Programs often focus these efforts on species that are considered globally at-risk (conservation status rank of G1 - Critically Imperiled, G2 - Imperiled, or G3 - Vulnerable) but may also track species that are of local conservation significance. In most cases, this section reports on precise EO records tracked by NatureServe member programs that have been shared with NatureServe for multi-jurisdictional analyses and that are classified as extant at the date of last observation. For those states that do not share precise data for this purpose (Massachusetts, Pennsylvania, and Arkansas), data are included based upon the public sharing rules put forth by those heritage programs. To see what level these data are shared at please refer to our Data Provider Portal Map.
There are known data gaps present across the NatureServe Network such as a lack of animal data in Washington and a lack of documented occurrence data of many private lands. This should be considered in the context of the location of the submitted site of interest. Please reach out to NatureServe or the local Natural Heritage Program for more information about potential data gaps.
Species results in this section are grouped taxonomically and presented as follows:
- ESA-listed species (Threatened or Endangered)
- Imperiled species (G1 or G2) not federally listed
NOTE: This section may be omitted from the report if no ESA-listed or imperiled species have been documented on or near the site and if the site’s extinction risk is low. This does not imply the site lacks biodiversity value – only that NatureServe does not currently have relevant EO or predictive data for the area. The site may still support common species, state or regionally rare species, and/or other environmental values. Users are encouraged to consult NatureServe’s state partners listed in the Detailed Species and Habitat Information section of the report for more data/information.
Recommended Actions:
This section provides suggestions on how to interpret the EO results shown in the ‘Imperiled Species On or Near the Site’ section of the report.
Local Information
If provided by the state Natural Heritage Programs, we include up to three links for additional relevant species information per overlapping state (e.g. wildlife migration corridors, additional species records) that may be useful in evaluation of the site. Note that not all states have provided local information.
Detailed Species and Habitat Information
NatureServe Network member programs maintain abundant local data on biodiversity assets that may not be well represented in the national datasets from which this report is sourced. In many cases, these programs also offer free or low cost online environmental review tools, which provide additional site-specific insight. Many can also provide additional local expertise, assist with surveys and/or work with partners to ensure that site data is incorporated into state databases, and/or help meet state environmental compliance requirements. Here, we provide program information and links to data resources for the NatureServe Network programs operating in the site vicinity.
Ecosystem Extent & Risk
This section provides information on ecosystems predicted to be at the site and are defined from the United States National Vegetation Classification at the group level.
Priority Ecosystem Extent & Risk
This section summarizes how the Priority Ecosystem Risk score compares to the national and state averages. This section provides additional detail on ecosystems mapped at the site based on NatureServe’s National Vegetation Classification (NVC) Group Map. A detailed description for each group is available on NatureServe Explorer and linked to the group names listed in the report.
The map displays the distribution of Ecosystem Vulnerability categories across the site of interest. The legend also identifies the number of acres within each vulnerability category. The ecosystem vulnerability categories are based on NVC group g-ranks and are defined as follows:
- Very High = G1, G2
- High = G3
- Medium = G4, G5, GNR
- Low = GNA
Recommended Actions:
This section offers guidance on interpreting the Ecosystem Risk results and understanding their implications for conservation across the site.
Natural Vegetation (2020 Baseline)
This section details the breakdown of vegetation types seen across the site into three categories:
- Natural Vegetation: Comprised of NVC groups that occur naturally
- Semi-natural Vegetation: Comprised of NVC groups that are slightly modified from their natural state due to land-use practices (e.g. ruderal types)
- Non-natural Vegetation: Comprised of anthropogenic types such as roads, urban areas, and agriculture.
Recommended Actions:
This section provides suggestions on how to manage the site to improve or maintain on the 2020 baseline percentage of natural vegetation.
Local Information
If provided by the state Natural Heritage Programs, we include up to three links for additional relevant ecosystem vulnerability information per overlapping state (e.g. local habitat/vegetation maps) that may be useful in evaluation of the site. Note that not all states have provided local information.
Ecosystem Condition
This section summarizes how the Ecosystem Condition score compares to the national and state averages.
The map displays the distribution of Ecosystem Condition categories across the site of interest. A legend identifies the number of acres within each risk category. The Ecosystem Condition categories are based on the LCM values described in Section 1: Ecosystem Condition and are defined by the range of values listed below:
- Very High = 75-100
- High = 50-75
- Medium = 25-50
- Low = 0-25
Local Information
If provided by the state Natural Heritage Programs, we include up to three links for additional relevant ecosystem condition information per overlapping state (e.g. condition maps, ecological integrity assessment tools) that may be useful in evaluation of the site. Note that not all states have provided local information.
Recommended Actions:
This section offers guidance on interpreting the Ecosystem Condition results and understanding their implications for conservation across the site.
Species & Habitat Field Report
This section supports on-the-ground conservation and land management efforts by providing a list of species that may be impacted by activities on or near the site. It includes both documented and predicted species that are of conservation concern.
Species View
List of Documented and Predicted Tracked Species
This section lists species that have either been documented or predicted to occur within or around the site of interest. The list is generated based on intersecting the site boundaries with two primary datasets:
- Element Occurrence (EO) data from the NatureServe Network (representing documented locations)
- Species Habitat Models (SHMs) developed by NatureServe (representing predicted suitable habitat)
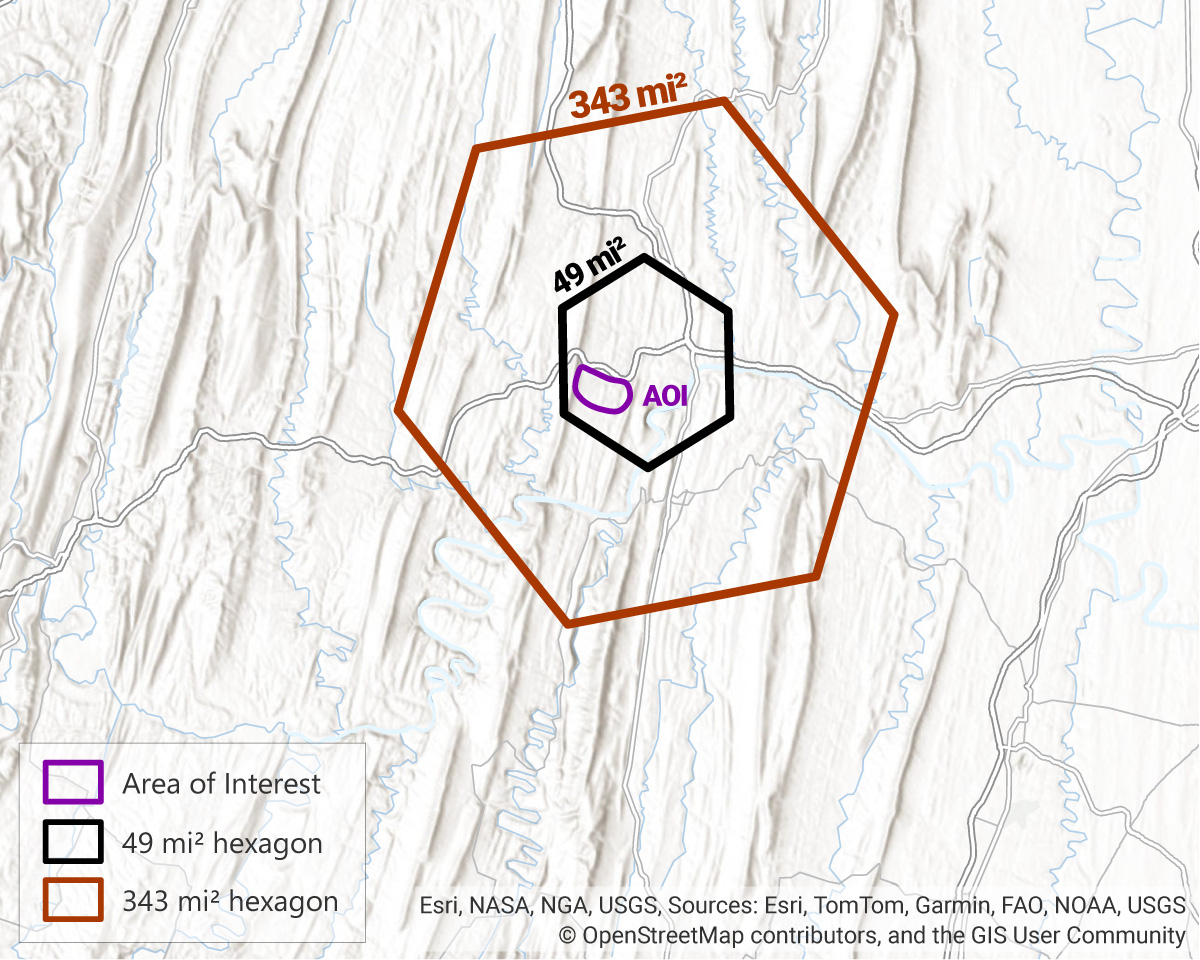
Documented species are those with EO records within or near the site. These occurrences are mapped based on available observation data, then fuzzed to a minimum of 1 square mile hexagons. Those hexagons are used to return the list of documented species that occur within or near the site. Note that at present, a species list is not available for Arizona or Wyoming.
In some cases - especially for species vulnerable to persecution- NatureServe’s Network programs may apply data protection measures, such as fuzzing location data to a larger hexagon size (7, 49, or 343 square miles) or omitting the species name (e.g. showing “an imperiled vertebrate” instead of a species name). For information on data sensitivity practices and how some of the species might have been fuzzed before inclusion in this report, see our Data Provider Portal Map.
Predicted species are identified through an intersection with NatureServe’s library of SHMs. These models use known occurrence data and data characterizing environmental conditions at those locations to predict suitable habitat for at-risk species. The model output is statistically categorized into high, medium, and low habitat suitability for the species. For the purposes of this analysis, only high suitability habitat for each species are included. In addition, only species meeting one or more of the following criteria are included:
- Global rank of G1/T1, G2/T2, or G3/T3
- Listed, proposed, or candidate species under the U.S. Endangered Species Act (ESA) regardless of the global rank.
A list of all modeled species is available through NatureServe’s SHM Dashboard. See the NatureServe Network SHM Data Standard for more information on our methods for SHM development, including how probability of habitat is defined and how model confidence is scored.
The table in this section includes:
- Common and scientific names (linked to NatureServe Explorer)
- Global conservation rank (G-rank)
- ESA status
- Occurrence type (Documented or Predicted)
- Major habitats associated with each species
Habitat data is maintained in NatureServe’s Biotics database and is currently available for approximately 60% of G1-G3 species nationally. The Major Habitat Types column lists the broad habitat types each species is known to use somewhere in its range. These types may or may not be present on the site itself. However, this information – combined with the local habitat data – can help guide targeted conservation and land use decisions. Where available, more detailed information is included in the Habitat Details column.
Sensitive Species
NatureServe maintains information on threats to the species we track. Threats data are available for approximately 35% of G1-G3 species nationally. Threats are classified per the IUCN threats classification scheme (Salafsky et al. 2008) using a standard hierarchical list of threat categories. Here, we summarize information on threats for all species documented at the site for which threats information is available. Please note that the data indicate whether the threat impacts the species across its full distribution and does not necessarily indicate that it is present at the site. Note that this data is currently only available within the ‘Report JSON’ download.
Tracked Species Threats Summary
NatureServe maintains information on threats to the species we track. Threats data are available for approximately 35% of G1-G3 species nationally. Threats are classified per the IUCN threats classification scheme (Salafsky et al. 2008) using a standard hierarchical list of threat categories. Here, we summarize information on threats for all species documented at the site for which threats information is available. Please note that the data indicate whether the threat impacts the species across its full distribution and does not necessarily indicate that it is present at the site.
Literature Cited
This section provides information that are predicted and documented ecosystems (when available) at the site.
Franklin, S., D. Faber-Langendoen, M. Jennings, T. Keeler-Wolf, O. Loucks, A. McKerrow, R.K. Peet, and D. Roberts. 2012. Building the United States National Vegetation Classification. Annali di Botanica 2:1-9.
Hamilton, Healy, Regan L. Smyth, Bruce E. Young, Timothy G. Howard, Christopher Tracey, Sean Breyer, D. Richard Cameron, et al. 2022. “Increasing Taxonomic Diversity and Spatial Resolution Clarifies Opportunities for Protecting US Imperiled Species.” Ecological Applications 32(3): e2534. LINK
U.S. Geological Survey (USGS) Gap Analysis Project (GAP), 2024, Protected Areas Database of the United States (PAD-US) 4.0: U.S. Geological Survey data release. LINK
Hak, J.C. and P.J. Comer. 2017. Modeling Landscape Condition for Biodiversity Assessment – Application in Temperate North America. Ecological Indicators Vol. 82:206-216. LINK
Salafsky, N., Salzer, D., Stattersfield, A. J., Hilton-Taylor, C., Neugarten, R., Butchart, S. H. M., Collen, B., Cox, N., Master, L. L., O’Connor, S., & Wilkie, D. (2008). A standard lexicon for biodiversity conservation: Unified classifications of threats and actions. Conservation Biology, 22, 897–911.
Wiken, Ed, Francisco Jiménez Nava, and Glenn Griffith. 2011. North American Terrestrial Ecoregions—Level III. Commission for Environmental Cooperation, Montreal, Canada. LINK
The information on this page was updated on 7/3/2025.
